Blog
Thoughts on engineering, design, and building great products.
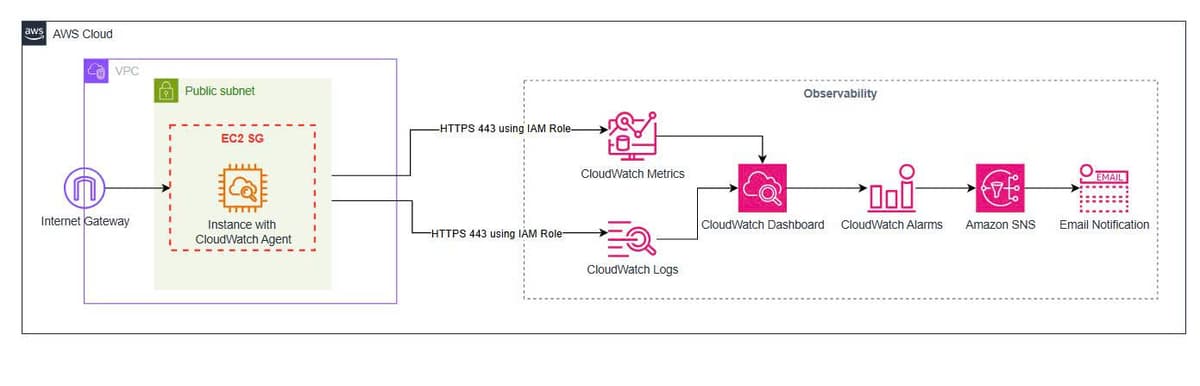
AWS-native Observability for EC2 with the CloudWatch Agent
A hands-on lab building an observability pipeline for EC2 with the CloudWatch Agent, CloudWatch Logs, CloudWatch Metrics, Alarms, SNS email and a Dashboard, across two real cases: installing the agent on an existing EC2 instance, and bootstrapping the agent at launch time on a brand-new one.
CloudWatch: Alarms, Dashboards, and SLOs for the API
With logs, traces, and metrics in place, the next step is knowing automatically when the system has a problem. Define SLOs for the API, build CloudWatch alarms that fire when errors or throttles cross a threshold, gather metrics into a dashboard, and use Logs Insights to compute indicators from structured logs. Push a real alarm into ALARM state by causing a throttle.
CloudWatch: Monitoring and Viewing Your Application's Logs
Create a CPU alarm that emails you via SNS, and ship container logs to CloudWatch Logs for centralized viewing. Know how the system is running and get alerted when something goes wrong.