AWS-native Observability for EC2 with the CloudWatch Agent
When you run a workload on EC2, CloudWatch gives you only a small slice of the operational picture out of the box: CPU, network, disk I/O, and status checks. In real DevOps/SRE work that is not enough. You usually also want to know how much memory is in use, whether the root disk still has free space, whether the Nginx process is still running, whether the access/error logs contain anything wrong, and whether the system actually alerts you when a threshold is crossed.
This lab is a hands-on build of a simple but realistic observability pipeline for EC2, done the AWS-native way with the CloudWatch Agent.
I run it as two scenarios:
Case 1: An EC2 instance already exists, is running Nginx, but has no CloudWatch Agent yet.
Case 2: Create a brand-new EC2 instance and bootstrap the CloudWatch Agent via User Data.
The point of this article is not just "install the agent", but walking the whole flow end to end:
EC2
→ CloudWatch Agent
→ CloudWatch Metrics
→ CloudWatch Logs
→ CloudWatch Dashboard
→ CloudWatch Alarm
→ Amazon SNS
→ Email Notification
Why do you need the CloudWatch Agent?
By default, EC2 basic monitoring observes the instance from the outside, mostly through the hypervisor. That is why CloudWatch can see metrics such as CPU, network, disk I/O, and status checks.
However, information that lives inside the operating system, such as how much memory is in use, how much space is left on a filesystem, what the application logs are writing, or whether the Nginx process is still running, is not visible to CloudWatch with basic monitoring alone.
The CloudWatch Agent closes that gap by running inside the EC2 instance. The agent reads metrics and logs from the operating system, then ships the data to CloudWatch Metrics and CloudWatch Logs.
In short:
EC2 basic monitoring
→ sees the instance from the outside

CloudWatch Agent
→ sees inside the operating system
That is why data such as memory usage, disk usage, application logs, and process status requires the CloudWatch Agent.
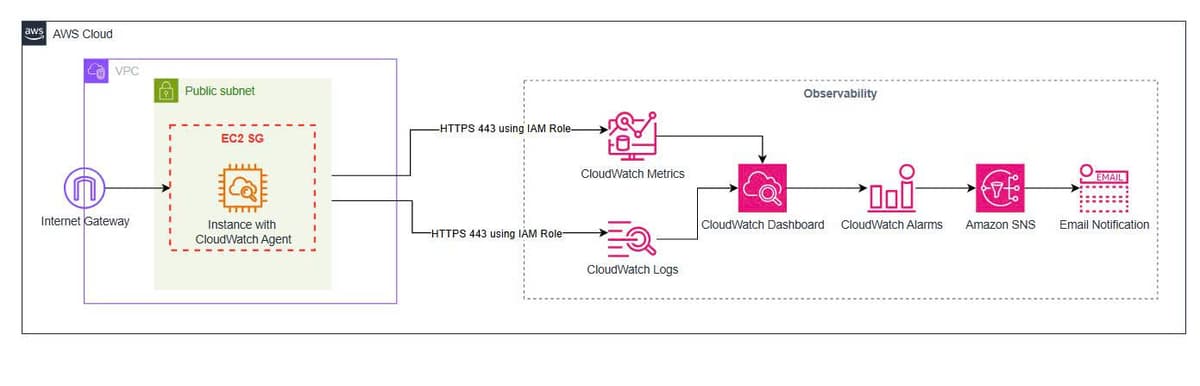
High-level architecture
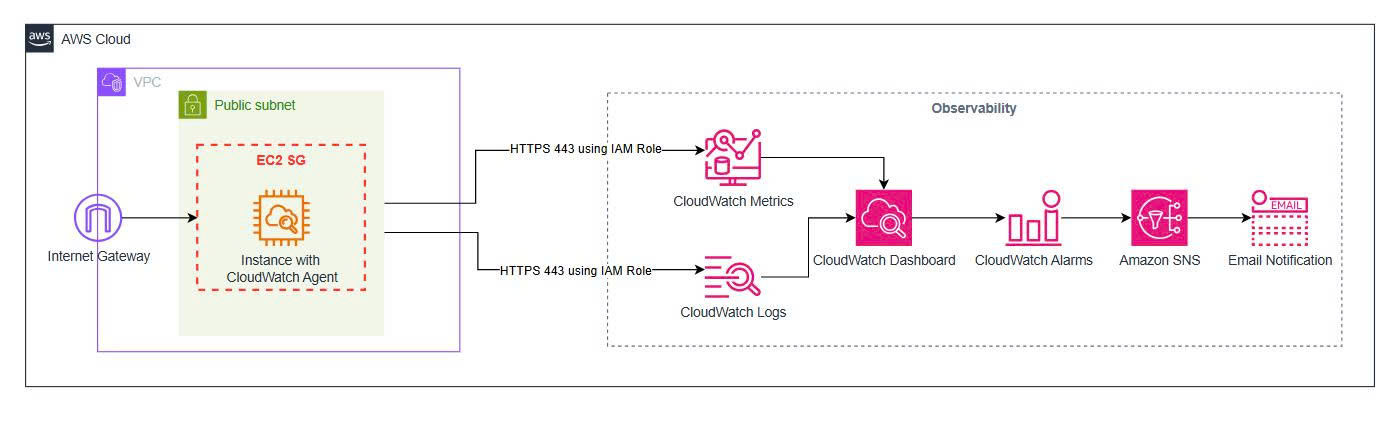
In this architecture, EC2 runs both the Nginx workload and the CloudWatch Agent. The agent runs inside the instance, reads metrics at the operating-system level, reads Nginx log files, and then ships the data to CloudWatch.
The main flow:
User / Local terminal
→ AWS Systems Manager Session Manager
→ EC2 instance
→ CloudWatch Agent
→ CloudWatch Metrics / CloudWatch Logs
→ Dashboard / Alarm
→ SNS Email Notification
I do not use SSH in this lab. The EC2 instance is accessed through AWS Systems Manager Session Manager, which means no need to open port 22, no key pair, and access control is managed through IAM.
Repository structure
Evidence, architecture, and scripts should be kept separate so they are easy to review:
cloudwatch-agent-ec2-observability/
├── architecture/
│   └── high-level-architecture.jpg
│
├── evidence/
│   ├── Case 1 - Existing EC2 Running.jpg
│   ├── Case 1 - IAM Role Attached.jpg
│   ├── Case 1 - SSM Managed Node.jpg
│   ├── Case 1 - CloudWatch Agent Installed.jpg
│   ├── Case 1 - Agent Running.jpg
│   ├── Case 1 - CWAgent Metrics.jpg
│   ├── Case 1 - CloudWatch Logs.jpg
│   ├── Case 1 - CloudWatch Alarm.jpg
│   ├── Case 1 - SNS Email Confirmed.jpg
│   ├── Case 1 - CloudWatch Dashboard.jpg
│   ├── Case 2 - New EC2 Running.jpg
│   ├── Case 2 - Agent Running.jpg
│   ├── Case 2 - Key CWAgent Metrics.jpg
│   ├── Case 2 - CloudWatch Log Groups.jpg
│   └── Case 2 - CloudWatch Dashboard.jpg
│
├── scripts/
│   ├── case1-cloudwatch-agent-config.json
│   ├── case2-user-data.sh
│   └── cleanup.sh
│
├── 01-cloudwatch-agent-lab-evidence.md
└── 01-aws-native-observability-for-ec2-with-cloudwatch-agent.md
This blog file only explains the flow and the key results. The long CloudWatch Agent config and the User Data are kept under the scripts/ directory so they are easy to reuse.
AWS services used
| Service | Role |
|---|---|
| Amazon EC2 | The host running the Nginx workload |
| CloudWatch Agent | Collects metrics and logs from inside EC2 |
| CloudWatch Metrics | Stores memory, disk, CPU, and process metrics |
| CloudWatch Logs | Stores Nginx access/error logs and system logs |
| CloudWatch Dashboard | Visualizes the important metrics |
| CloudWatch Alarm | Alerts when a metric crosses a threshold |
| Amazon SNS | Sends the email notification when an alarm is triggered |
| IAM Role | Grants EC2 permission to send data to CloudWatch |
| AWS Systems Manager | Accesses EC2 via Session Manager instead of SSH |
Cost and Log Retention
The CloudWatch Agent can incur cost depending on the number of custom metrics, the number of log events, how long logs are retained, and how frequently metrics are collected.
In this lab, metrics such as memory, disk, and Nginx process count are sent into the CWAgent namespace. These are custom metrics, so the cost depends on the number of metrics, the number of dimensions, and how long the data is stored/observed.
I set metrics_collection_interval to 60 seconds to balance granularity against cost:
metrics_collection_interval: 60
Lowering the interval to 10 seconds gives more detailed data but increases the number of datapoints, which in turn can raise CloudWatch cost. So for a lab or a small environment, 60 seconds is the more sensible choice.
For CloudWatch Logs, if you do not configure retention, a log group can keep logs indefinitely. So once a log group is created, you should set a retention policy to avoid keeping logs you do not need.
For example, setting a 7-day retention for Case 1:
aws logs put-retention-policy \
  --log-group-name "/ec2/cloudwatch-agent/case1/nginx/access" \
  --retention-in-days 7 \
  --region us-east-1
aws logs put-retention-policy \
  --log-group-name "/ec2/cloudwatch-agent/case1/nginx/error" \
  --retention-in-days 7 \
  --region us-east-1
For example, setting a 7-day retention for Case 2:
aws logs put-retention-policy \
  --log-group-name "/ec2/cloudwatch-agent/case2/nginx/access" \
  --retention-in-days 7 \
  --region us-east-1
aws logs put-retention-policy \
  --log-group-name "/ec2/cloudwatch-agent/case2/nginx/error" \
  --retention-in-days 7 \
  --region us-east-1
In production, retention should be chosen according to audit, compliance, and cost needs, for example 7 days, 14 days, 30 days, or longer.
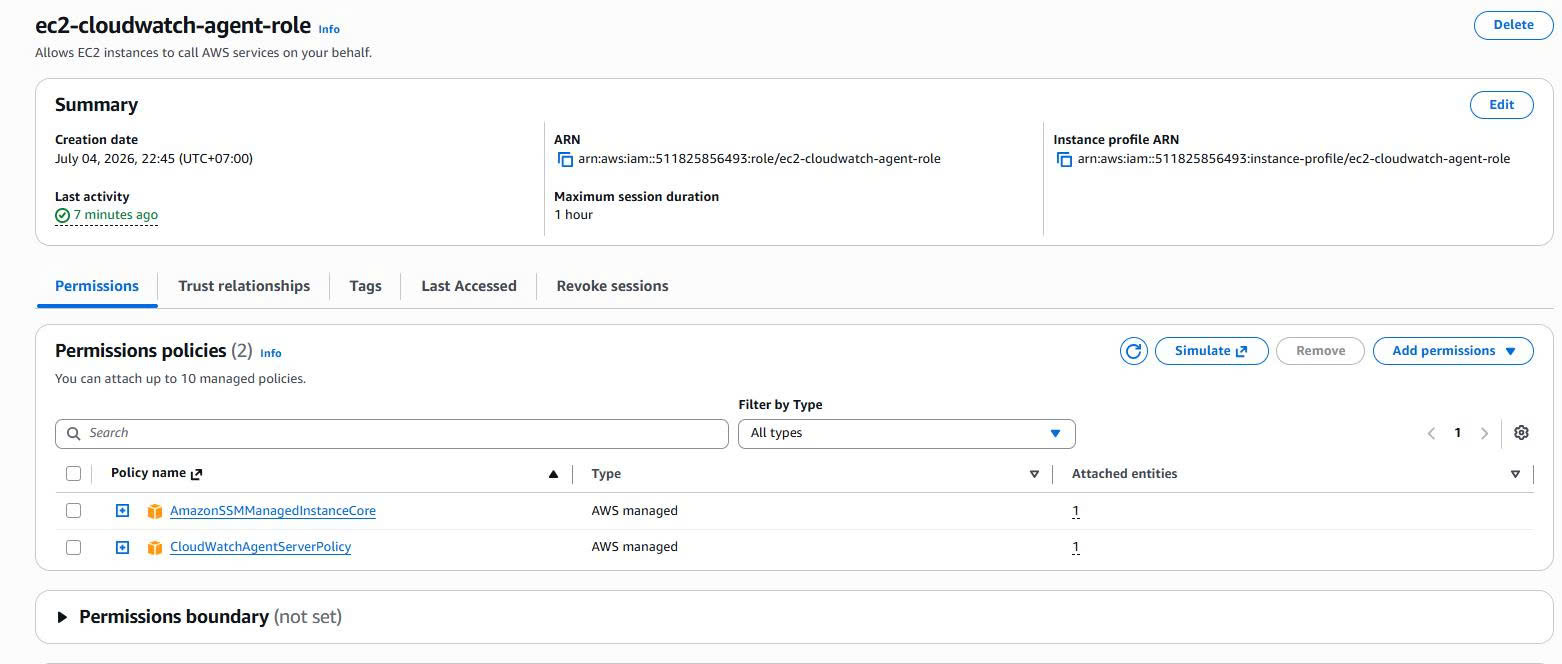
Preparing the IAM Role for EC2
The CloudWatch Agent needs permission to send metrics and logs to CloudWatch. EC2 also needs permission to work with Systems Manager Session Manager.
I create an IAM Role for EC2:
ec2-cloudwatch-agent-role
Attach two managed policies:
CloudWatchAgentServerPolicy
AmazonSSMManagedInstanceCore
What they mean:
CloudWatchAgentServerPolicy
→ Allows the CloudWatch Agent to send metrics/logs to CloudWatch.

AmazonSSMManagedInstanceCore
→ Allows EC2 to appear in Systems Manager and be accessed via Session Manager.
Evidence:
Connecting to EC2 with Session Manager
Instead of SSH, I use the AWS CLI from my local machine to connect to EC2:
aws ssm start-session \
  --target <your-ec2-instance-id> \
  --region us-east-1
Example:
aws ssm start-session \
  --target i-xxxxxxxxxxxxxxxxx \
  --region us-east-1
Once inside the EC2 instance, switch to root to work through the lab:
sudo su -
whoami
Check the OS and hostname:
hostname
cat /etc/os-release
This approach means the lab never has to open SSH port 22 to the Internet.
Case 1: Installing the CloudWatch Agent on an existing EC2 instance
Context
In the first case, I assume there is already an EC2 instance running the Nginx workload. This instance has never had the CloudWatch Agent installed. This is a fairly realistic situation: the system is already running, and then the DevOps/SRE team wants to add observability without rebuilding the instance.
The execution flow:
Existing EC2
→ Attach IAM Role
→ Check the SSM Managed Node
→ Check that Nginx is running
→ Confirm the CloudWatch Agent is not installed
→ Install the CloudWatch Agent
→ Create the CloudWatch Agent config
→ Start the CloudWatch Agent
→ Verify Metrics and Logs
→ Create the Alarm, SNS, and Dashboard
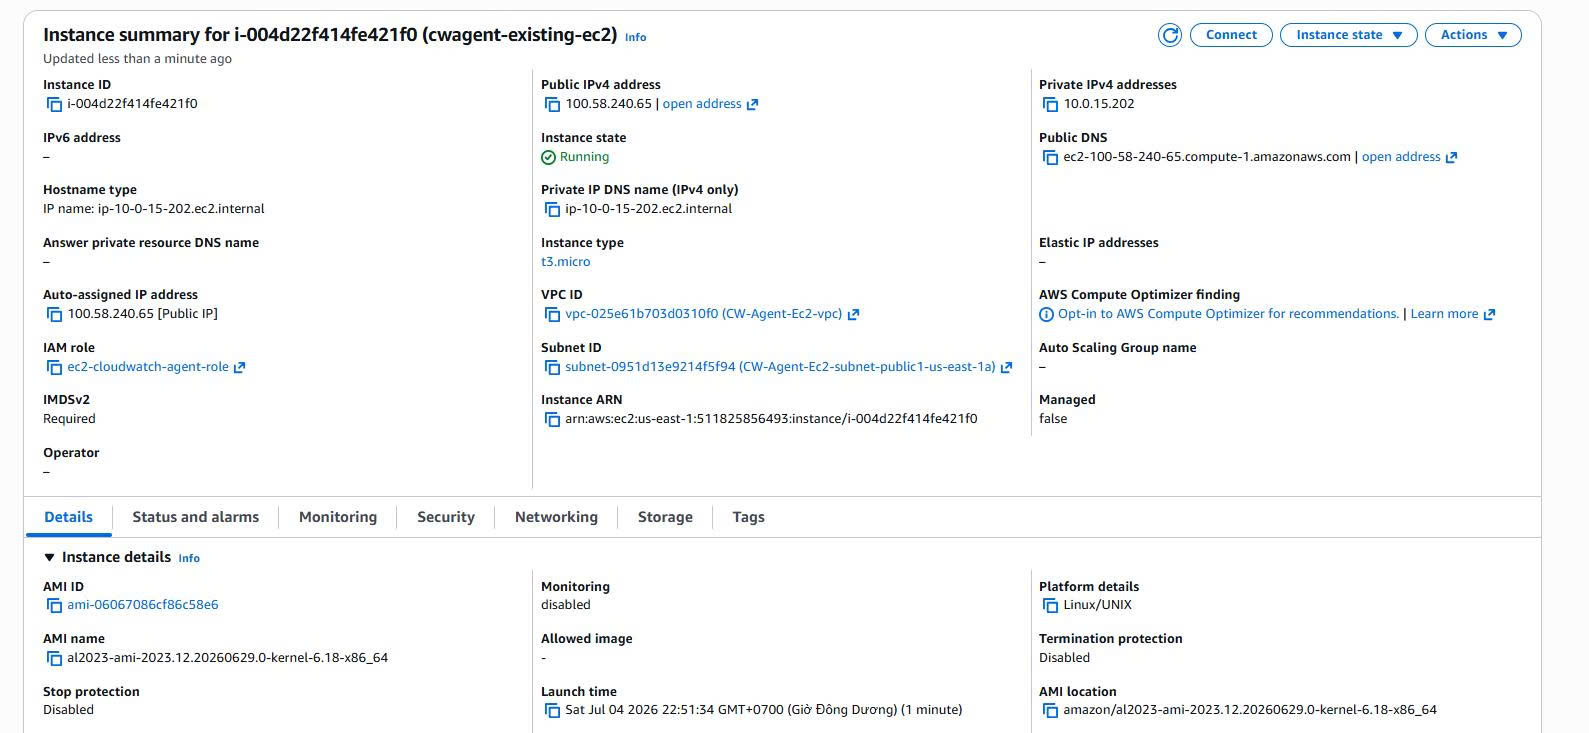
Inspecting the current EC2 instance
The instance used in Case 1:
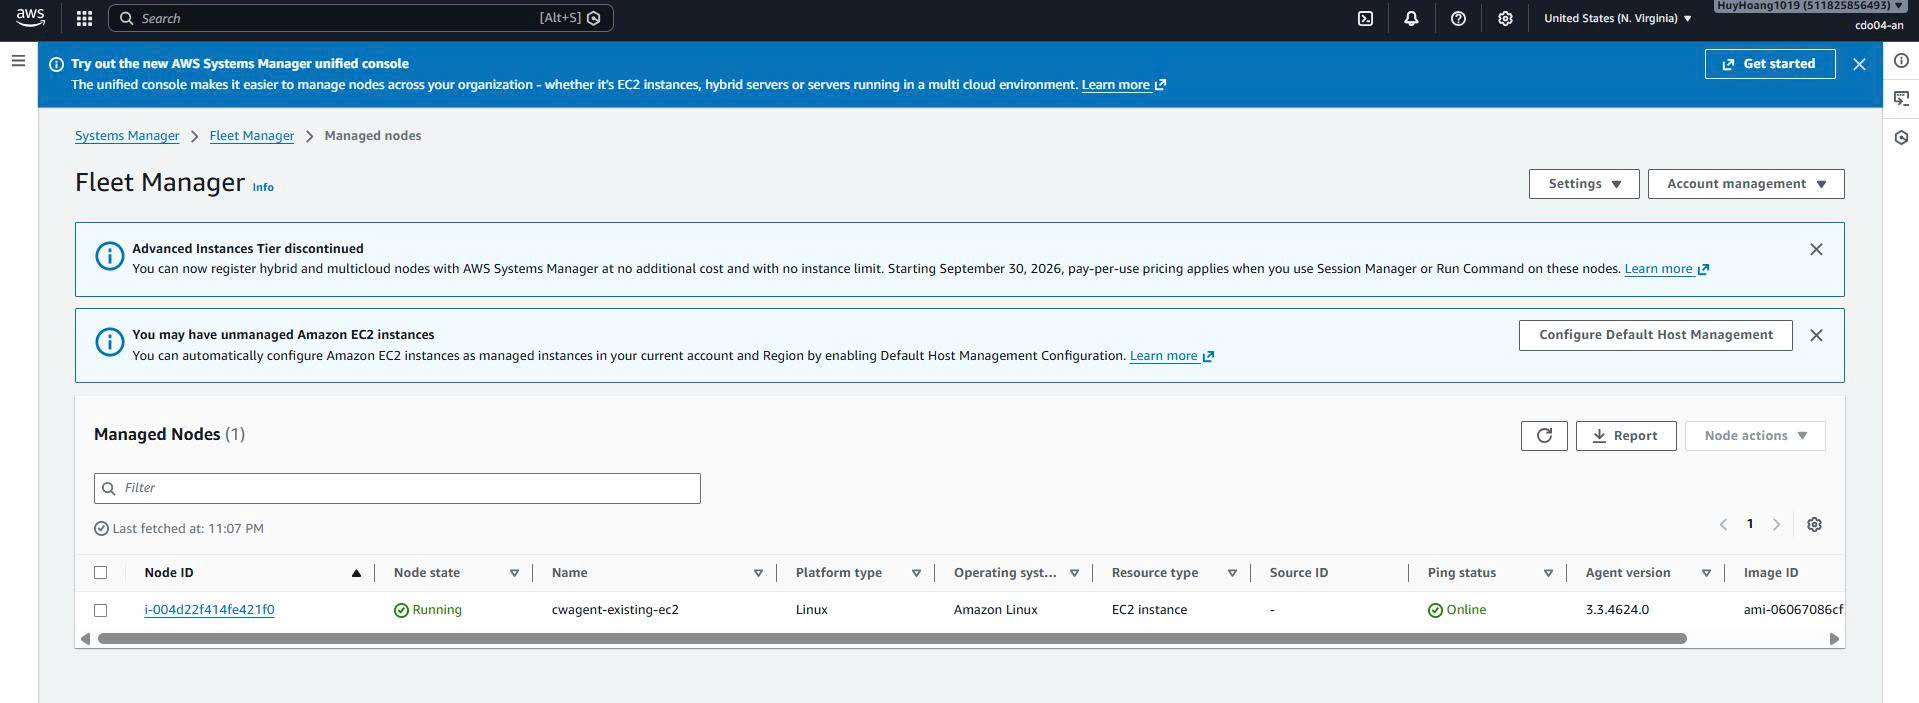
Instance name: cwagent-existing-ec2
Instance ID: i-004d22f414fe421f0
AMI: Amazon Linux 2023
Instance type: t3.micro
VPC: CW-Agent-Ec2-vpc
Subnet: Public subnet us-east-1a
IAM Role: ec2-cloudwatch-agent-role
Evidence:
The EC2 instance also appears under AWS Systems Manager Managed Nodes with the status Online.
Inspecting the workload and the initial state
After connecting to EC2 with Session Manager, I check:
whoami
hostname
cat /etc/os-release
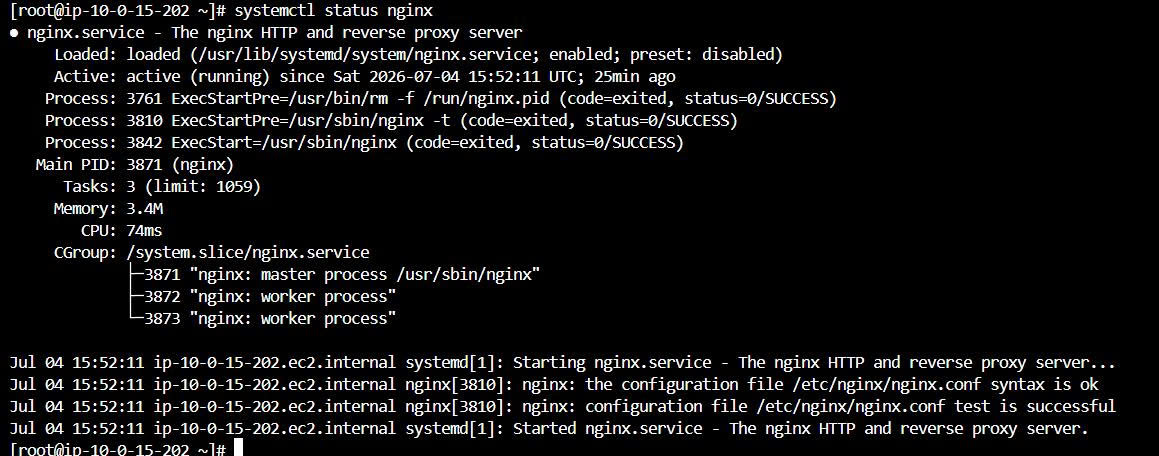
systemctl status nginx
rpm -qa | grep amazon-cloudwatch-agent
The result:
Current user: root
OS: Amazon Linux 2023
Nginx: active running
CloudWatch Agent: not installed
Evidence:

This confirms the intended context: the EC2 instance already has a workload but no CloudWatch Agent.
Installing the CloudWatch Agent
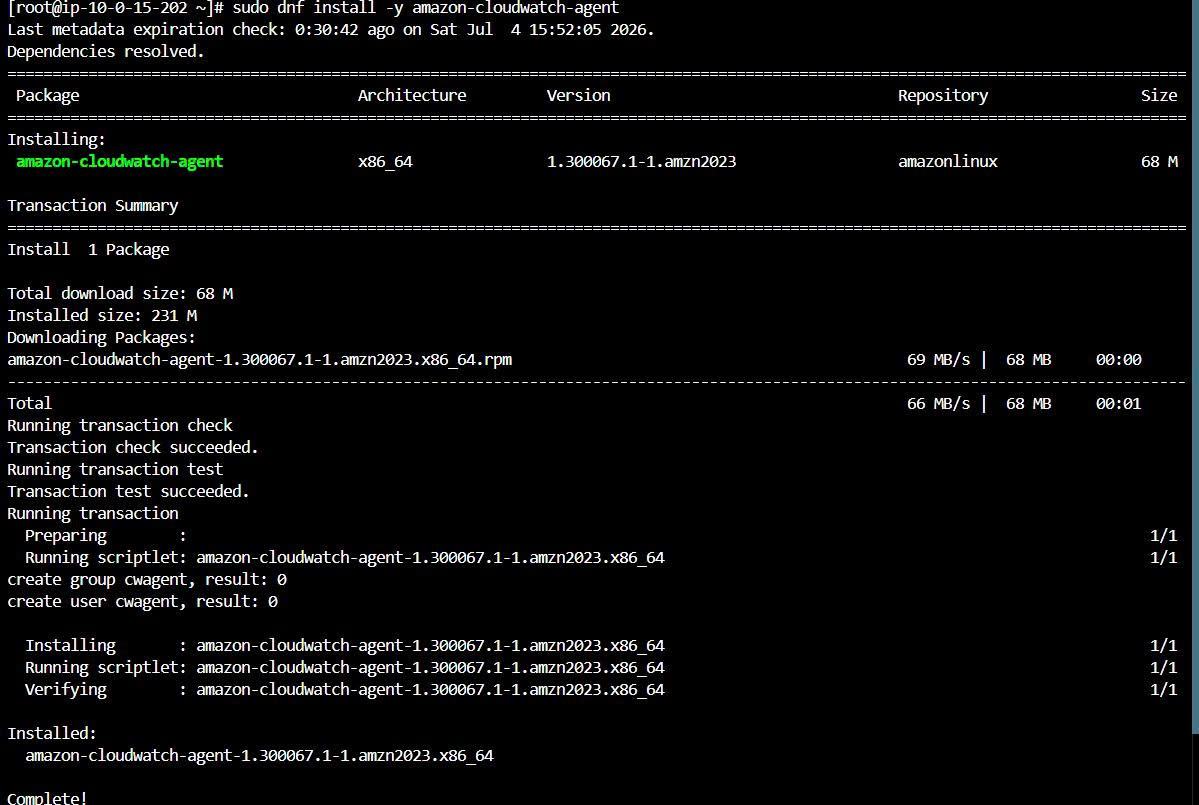
Install the CloudWatch Agent package on Amazon Linux 2023:
sudo dnf install -y amazon-cloudwatch-agent
Verify the package:
rpm -qa | grep amazon-cloudwatch-agent
ls -l /opt/aws/amazon-cloudwatch-agent/
Evidence:
Creating the CloudWatch Agent config
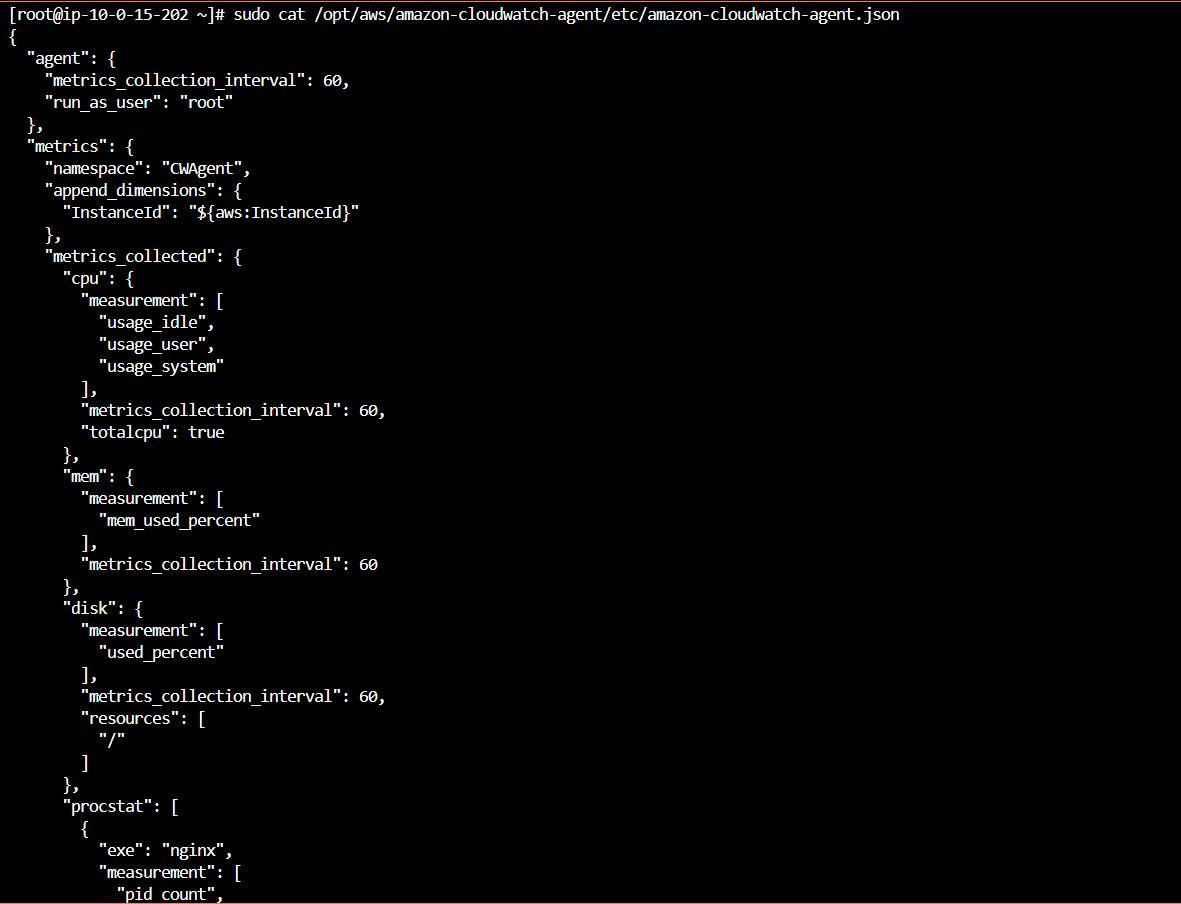
The config file lives at:
/opt/aws/amazon-cloudwatch-agent/etc/amazon-cloudwatch-agent.json
The full config is kept in the repo at: Case 1 - Agent Config file
This config collects:
Metrics:
- mem_used_percent
- disk_used_percent
- cpu usage metrics
- Nginx process count via procstat

Logs:
- /var/log/nginx/access.log
- /var/log/nginx/error.log
The most important parts of the config are procstat and logs. procstat lets the CloudWatch Agent track the Nginx process, while the logs section lets the agent read log files on EC2 and ship them to CloudWatch Logs.
Example of the procstat section:
{
  "procstat": [
    {
      "exe": "nginx",
      "measurement": [
        "pid_count",
        "cpu_usage",
        "memory_rss"
      ],
      "metrics_collection_interval": 60
    }
  ]
}
Example of the log collection section for the Nginx access log:
{
  "file_path": "/var/log/nginx/access.log",
  "log_group_name": "/ec2/cloudwatch-agent/case1/nginx/access",
  "log_stream_name": "{instance_id}-access",
  "timezone": "UTC"
}
I do not inline the entire JSON config so the article stays concise, but I still include the core parts so the reader understands what the agent is collecting. The full config lives under the scripts/ directory so it can be copied and run again.
Evidence:
Starting the CloudWatch Agent
Start the agent with the config just created:
sudo /opt/aws/amazon-cloudwatch-agent/bin/amazon-cloudwatch-agent-ctl \
  -a fetch-config \
  -m ec2 \
  -c file:/opt/aws/amazon-cloudwatch-agent/etc/amazon-cloudwatch-agent.json \
  -s
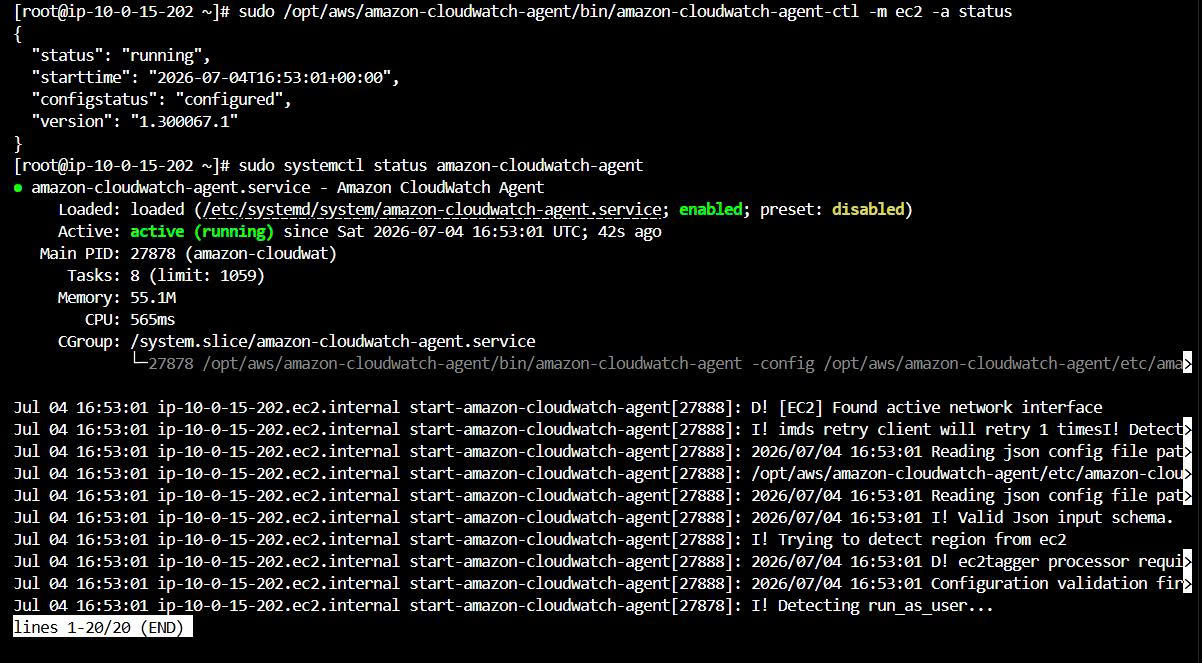
Check the status:
sudo /opt/aws/amazon-cloudwatch-agent/bin/amazon-cloudwatch-agent-ctl -m ec2 -a status
sudo systemctl status amazon-cloudwatch-agent
Expected result:
{
  "status": "running",
  "configstatus": "configured",
  "version": "1.300067.1"
}
Evidence:
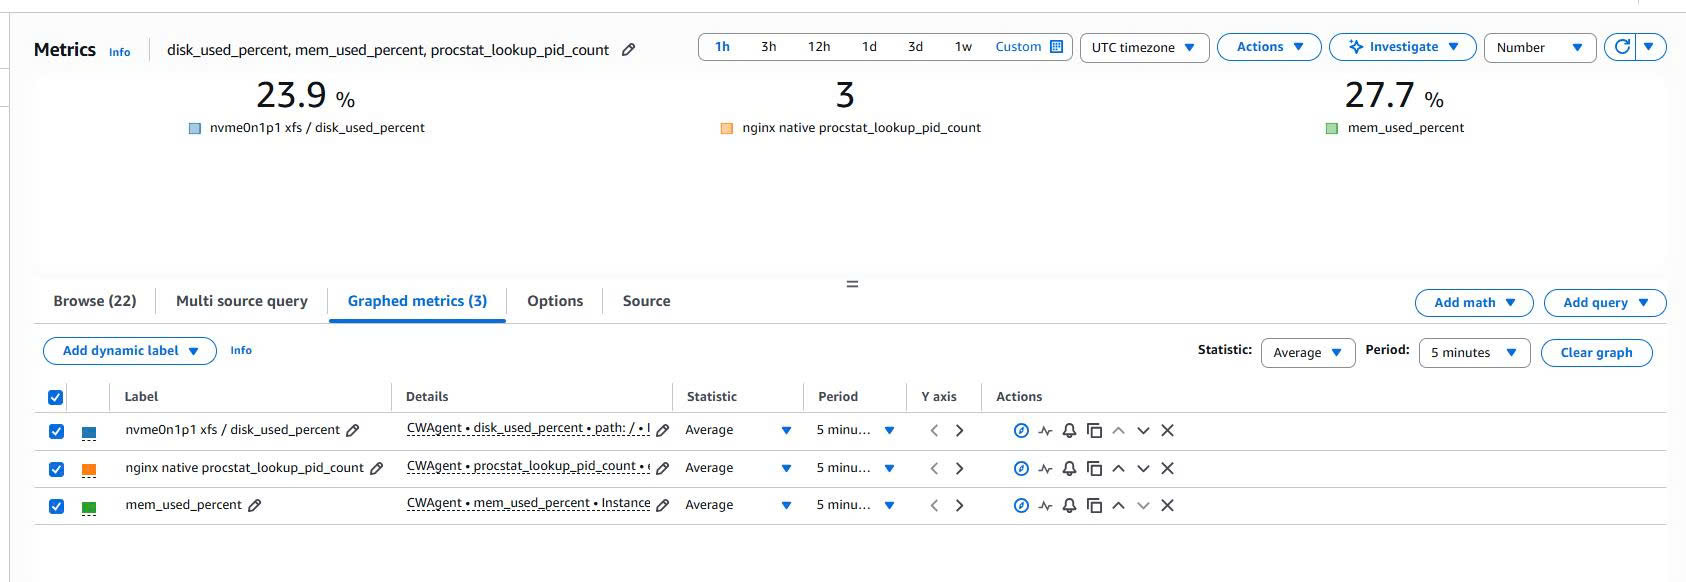
Verifying CloudWatch Metrics
Once the agent is running, go to CloudWatch Metrics and look for the namespace:
CWAgent
The main metrics to check:
mem_used_percent
disk_used_percent
procstat_lookup_pid_count
What they mean:
mem_used_percent
→ the percentage of memory in use.

disk_used_percent
→ the percentage of disk used on the `/` filesystem.

procstat_lookup_pid_count
→ the number of Nginx processes the CloudWatch Agent found.
Why can the Nginx Process Count be greater than 1?
The procstat_lookup_pid_count metric reports the number of Nginx processes the CloudWatch Agent found.
For Nginx, this value is usually greater than 1 because Nginx typically runs with the model:
1 master process
+ N worker processes
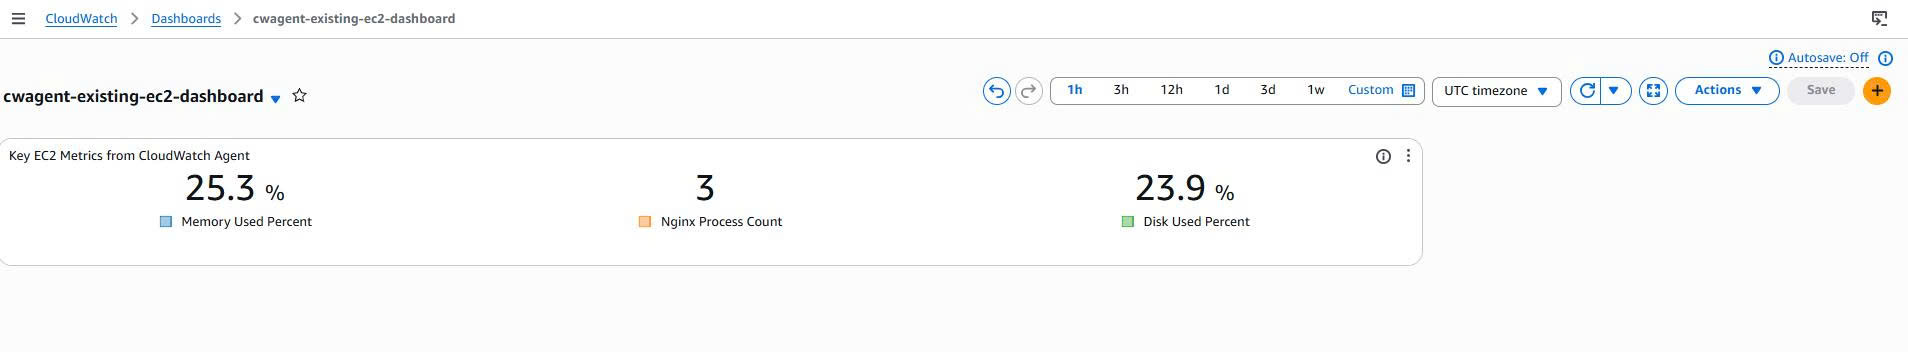
For example, if the dashboard shows:
Nginx Process Count = 3
that can be read as Nginx running 1 master process and 2 worker processes. So a value of 3 is not an error, but the normal state when Nginx is running multiple workers.
Evidence:
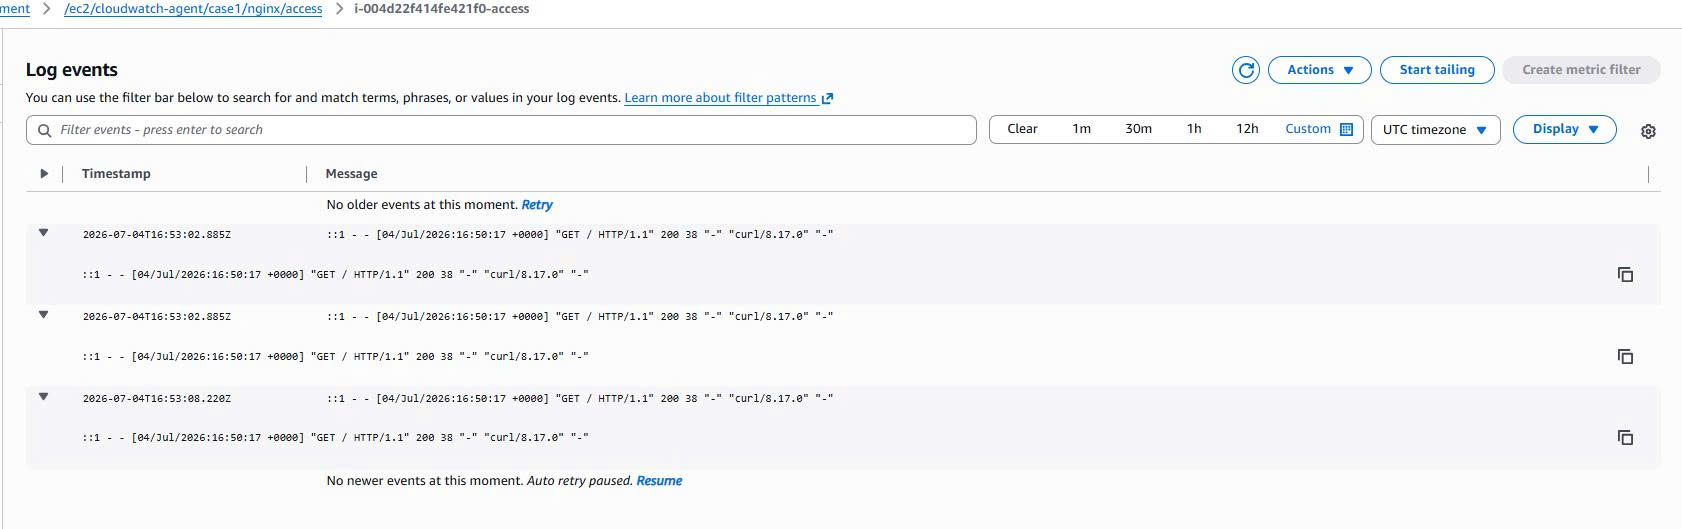
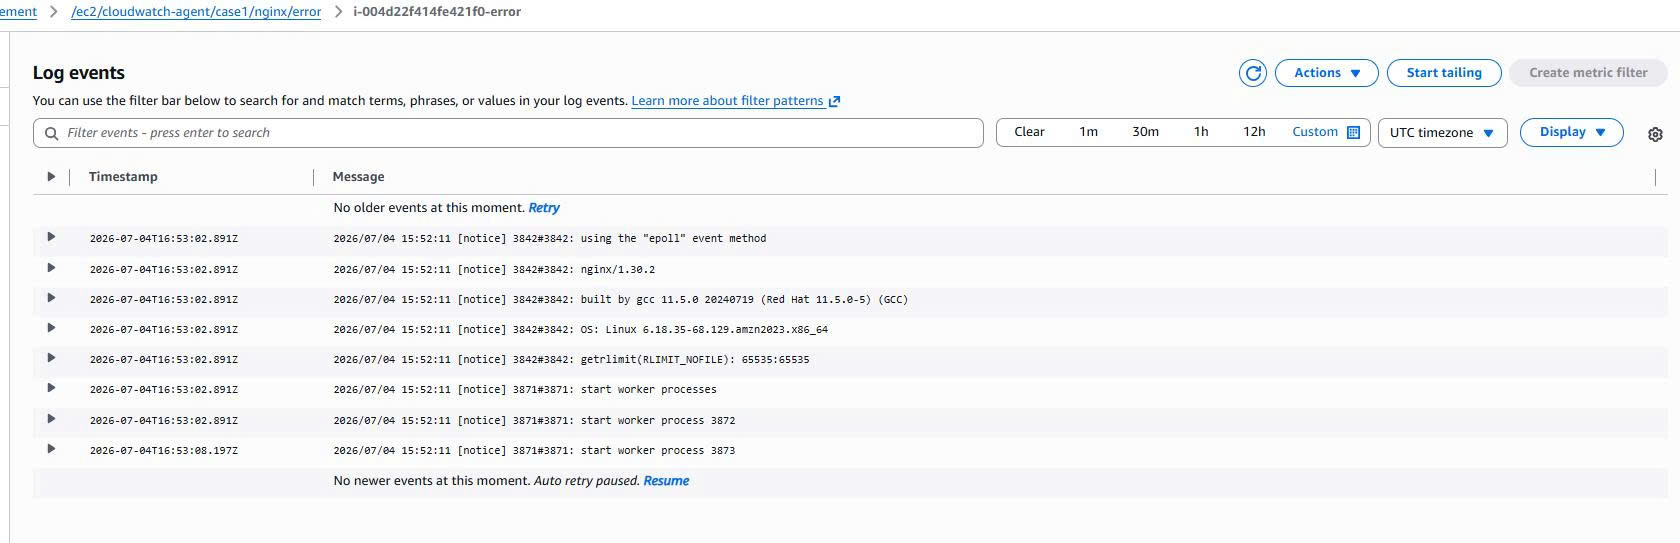
Verifying CloudWatch Logs
The CloudWatch Agent also ships Nginx logs to CloudWatch Logs.
The main log groups:
/ec2/cloudwatch-agent/case1/nginx/access
/ec2/cloudwatch-agent/case1/nginx/error
The Nginx access log contains a GET / HTTP/1.1 request, which proves that the log file on EC2 was read by the agent and shipped to CloudWatch Logs.
Evidence:
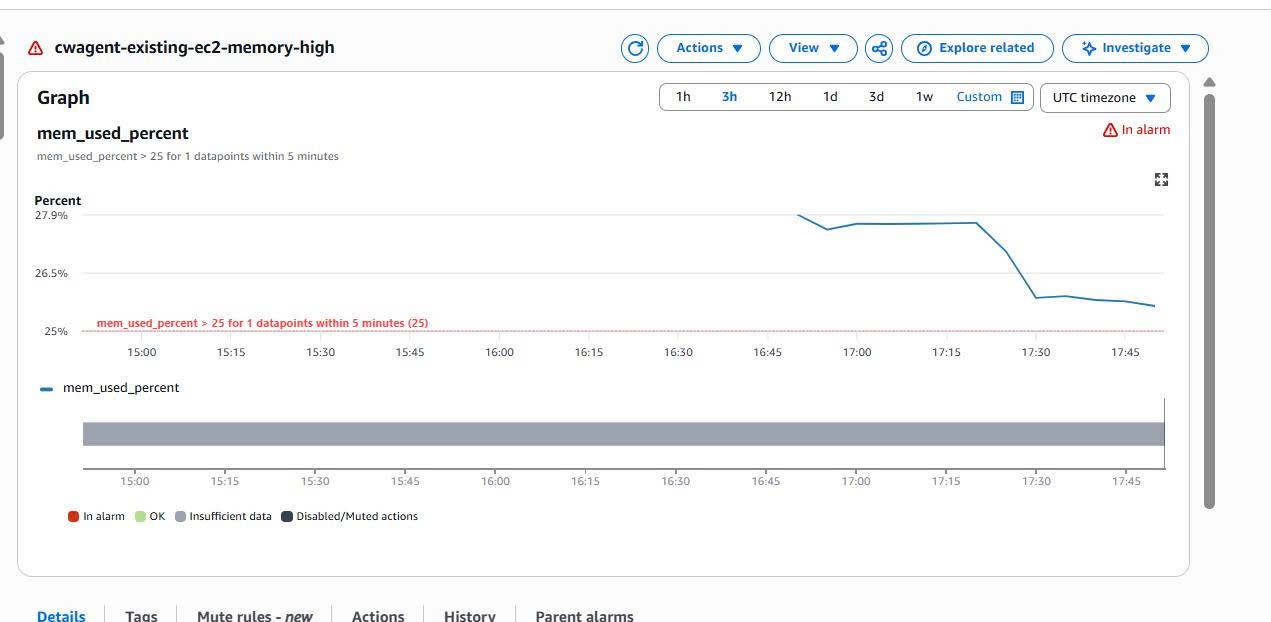
Creating a CloudWatch Alarm and SNS Email
Once the memory metric exists, I create a CloudWatch Alarm on the metric:
Metric: mem_used_percent
Namespace: CWAgent
Condition: Greater than threshold
Action: Send notification to SNS topic
In the lab, the threshold is set low so the alarm is easy to trigger and to capture evidence. For a production environment, the threshold should be set from an actual baseline, for example around 80% or 85%.
Beyond the threshold, when configuring an alarm you should also pay attention to these parameters:
| Property | Meaning |
|---|---|
Period |
The window over which datapoints are aggregated for each datapoint |
Evaluation periods |
The number of datapoints used to evaluate the alarm |
Datapoints to alarm |
The number of datapoints that must breach the threshold to move to ALARM |
TreatMissingData |
How to handle the case when the metric sends no data |
With a 1 out of 1 datapoint configuration, the alarm reacts quickly but is prone to false alarms on short spikes.
In production, you should use more evaluation periods, for example:
Period: 5 minutes
Evaluation periods: 3
Datapoints to alarm: 2 out of 3
This configuration reduces false alarms caused by temporary spikes.
TreatMissingData also matters a lot. If the CloudWatch Agent stops sending the metric, the alarm may move to, or get stuck in, the INSUFFICIENT_DATA state, depending on how it is configured. This is a real operational situation to account for when designing monitoring.
Evidence for the alarm:
Then create an SNS topic and an email subscription to receive the alerts.
Evidence for SNS:
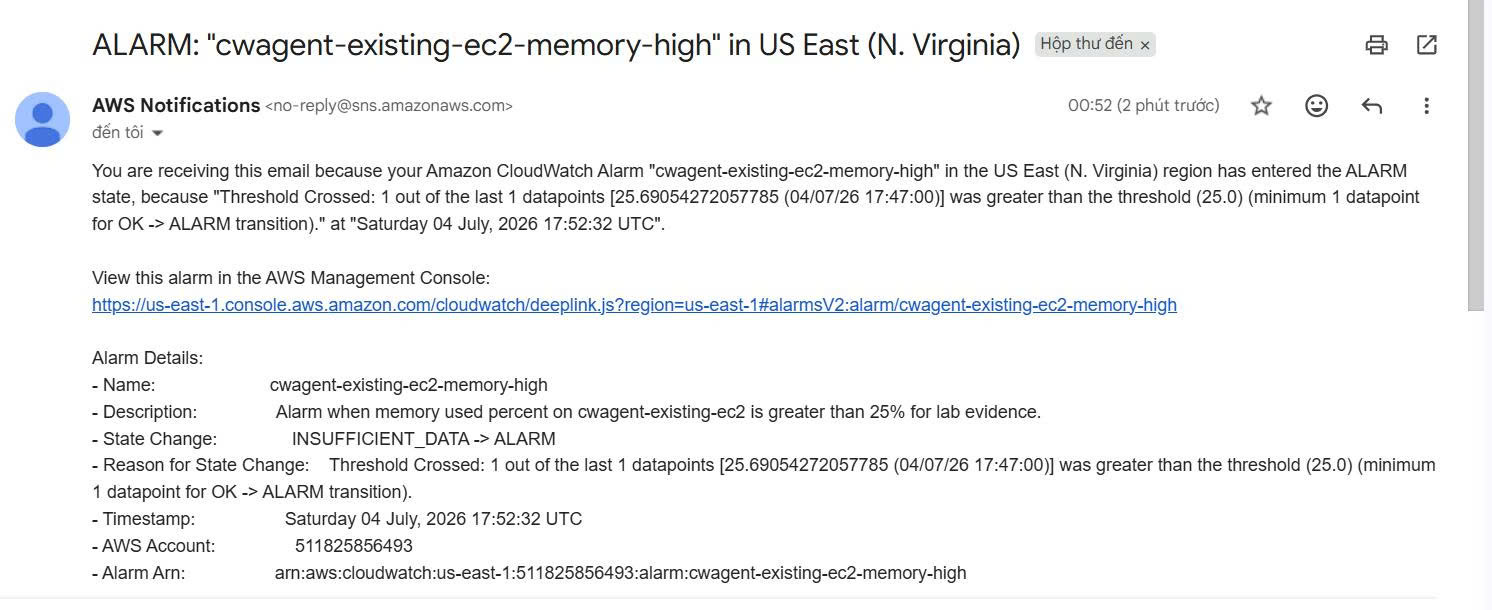
When the alarm changes state, an email notification is sent to the mailbox. This is the part that proves the alerting flow works end to end:
CloudWatch Metric
→ CloudWatch Alarm
→ SNS Topic
→ Email Notification
Creating a CloudWatch Dashboard
The dashboard helps visualize the important metrics of the EC2 instance.
Dashboard name:
cwagent-existing-ec2-dashboard
Metrics displayed:
Memory Used Percent
Nginx Process Count
Disk Used Percent
Evidence:
Case 1 results:
[✓] The existing EC2 is running the Nginx workload
[✓] The CloudWatch Agent was installed manually
[✓] The agent sends metrics to CloudWatch Metrics
[✓] The agent sends logs to CloudWatch Logs
[✓] The alarm was created and triggered
[✓] SNS sent the email notification
[✓] The dashboard displays the key metrics
Case 2: Bootstrapping the CloudWatch Agent when creating a new EC2 instance
Context
In Case 2, I no longer install the agent manually after EC2 is running. Instead, I use User Data to automatically:
Install Nginx
→ Start Nginx
→ Install the CloudWatch Agent
→ Write the CloudWatch Agent config
→ Start the CloudWatch Agent
→ Generate test requests with curl localhost
The flow:
Launch new EC2
→ Attach IAM Role
→ User Data installs Nginx
→ User Data installs CloudWatch Agent
→ User Data writes config
→ User Data starts CloudWatch Agent
→ Verify Logs, Metrics and Dashboard
Preparing the User Data
The User Data script is kept in the repo at: Case 2 - User Data
This script goes into:
EC2 Launch Instance
→ Advanced details
→ User data
User Data is the core of Case 2 because it lets the new EC2 instance bootstrap its own observability right at launch, instead of having to SSH/SSM into the box and install everything by hand.
The main idea of the User Data:
dnf update
→ install nginx
→ install amazon-cloudwatch-agent
→ enable/start nginx
→ write CloudWatch Agent config
→ start CloudWatch Agent
→ verify status
An important part of the User Data:
#!/bin/bash
set -euxo pipefail

dnf update -y
dnf install -y nginx amazon-cloudwatch-agent

systemctl enable nginx
systemctl start nginx

echo "Bootstrap EC2 for CloudWatch Agent lab" > /usr/share/nginx/html/index.html

curl http://localhost || true
curl http://localhost || true
curl http://localhost || true
The block above makes sure the new EC2 instance installs Nginx, starts the service, and generates a few test requests to produce Nginx access log entries.
The next part of the User Data writes the CloudWatch Agent config to the correct path on EC2:
cat > /opt/aws/amazon-cloudwatch-agent/etc/amazon-cloudwatch-agent.json <<'EOF'
{
  "agent": {
    "metrics_collection_interval": 60,
    "run_as_user": "root"
  },
  "metrics": {
    "namespace": "CWAgent",
    "append_dimensions": {
      "InstanceId": "${aws:InstanceId}"
    }
  }
}
EOF
In the full file, the config also includes mem, disk, cpu, procstat, and log collection for the Nginx/system logs. I only inline a short snippet so the reader understands what the User Data is doing; the full script is kept under the scripts/ directory.
Finally, the User Data starts the CloudWatch Agent with:
/opt/aws/amazon-cloudwatch-agent/bin/amazon-cloudwatch-agent-ctl \
  -a fetch-config \
  -m ec2 \
  -c file:/opt/aws/amazon-cloudwatch-agent/etc/amazon-cloudwatch-agent.json \
  -s

systemctl enable amazon-cloudwatch-agent
systemctl restart amazon-cloudwatch-agent
These commands make the CloudWatch Agent read the config just written and start shipping metrics/logs to CloudWatch right after EC2 finishes booting.
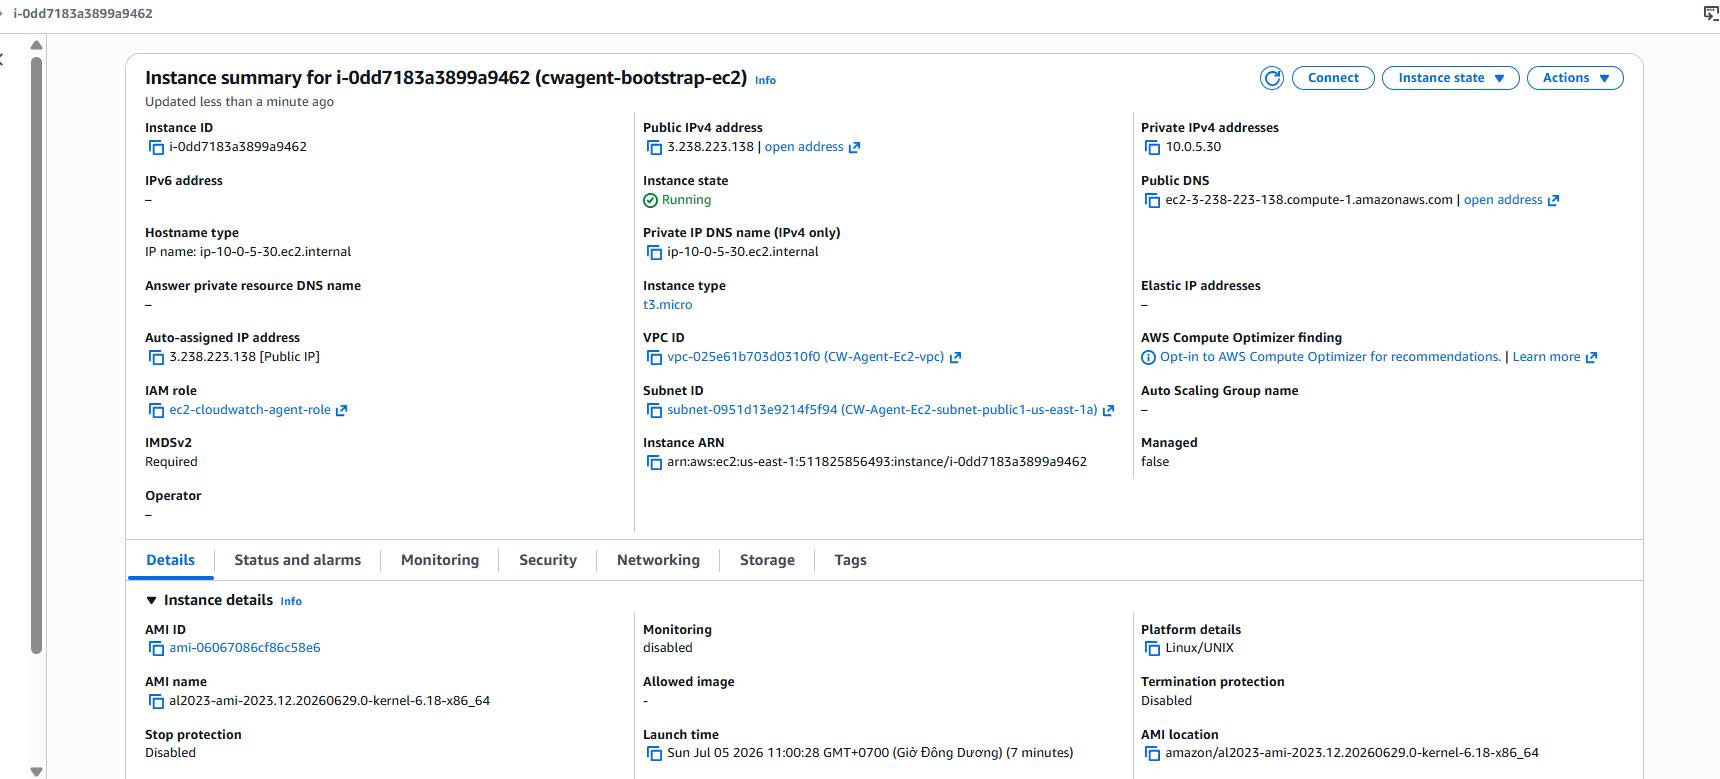
Launching the new EC2 instance
The instance used in Case 2:
Instance name: cwagent-bootstrap-ec2
Instance ID: i-0dd7183a3899a9462
AMI: Amazon Linux 2023
Instance type: t3.micro
VPC: CW-Agent-Ec2-vpc
Subnet: Public subnet us-east-1a
IAM Role: ec2-cloudwatch-agent-role
Evidence:
Verifying the CloudWatch Agent
After EC2 finishes booting, I connect to the instance with Session Manager and check the agent:
sudo /opt/aws/amazon-cloudwatch-agent/bin/amazon-cloudwatch-agent-ctl -m ec2 -a status
sudo systemctl status amazon-cloudwatch-agent
Evidence:
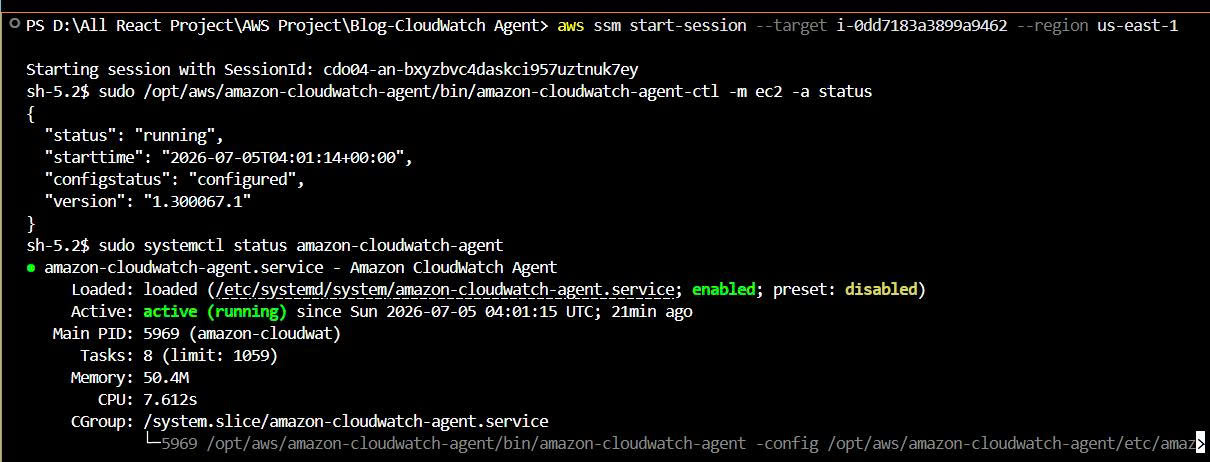
This proves that the User Data automatically installed and started the CloudWatch Agent when the EC2 instance was launched.
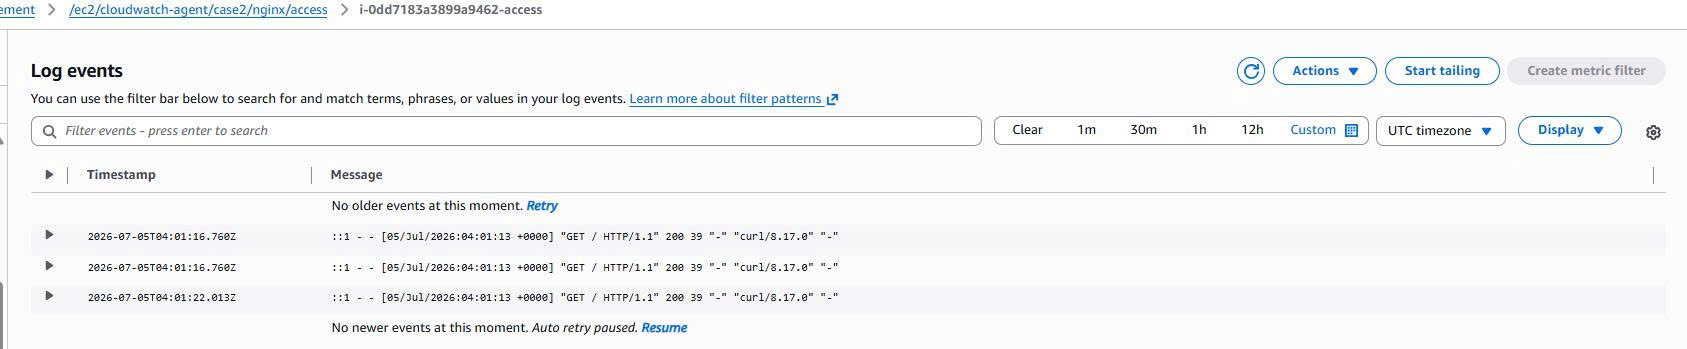
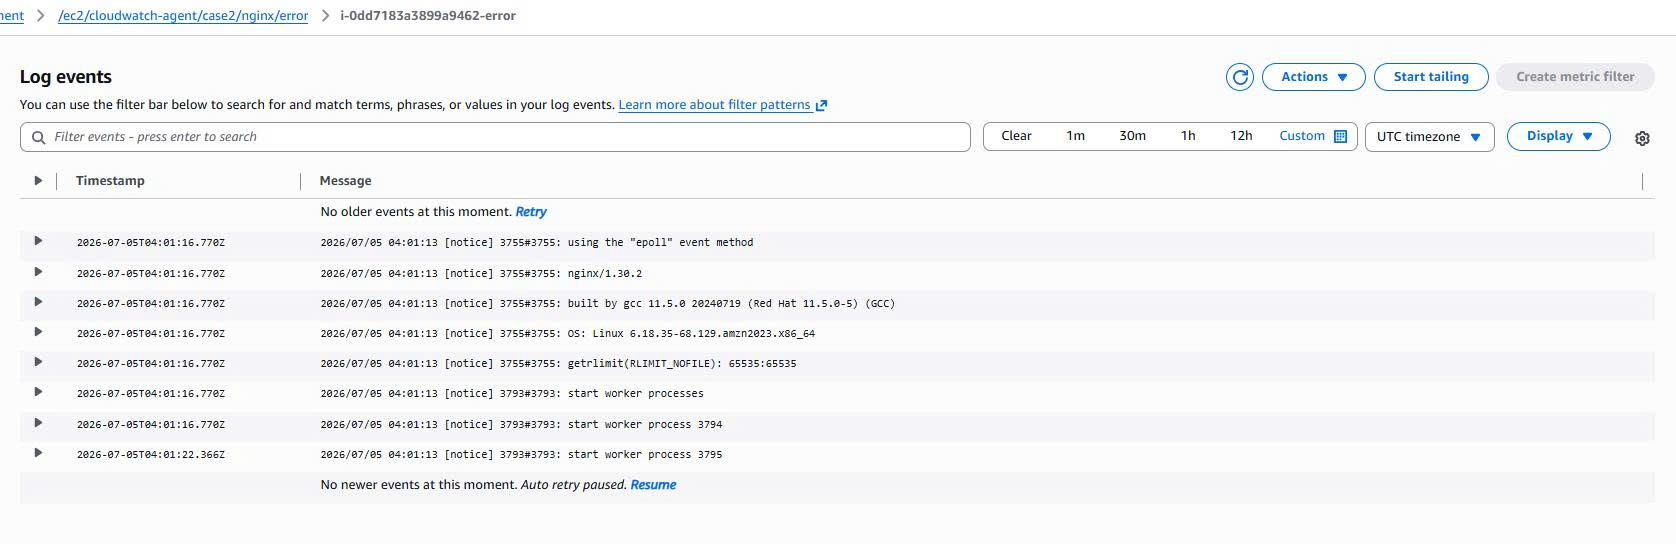
Verifying CloudWatch Logs
Case 2 creates its own separate log groups:
/ec2/cloudwatch-agent/case2/nginx/access
/ec2/cloudwatch-agent/case2/nginx/error
/ec2/cloudwatch-agent/case2/system/cloud-init
/ec2/cloudwatch-agent/case2/system/dnf
The Nginx access log contains requests from curl http://localhost, while the Nginx error log contains Nginx startup logs. This is proof that the User Data ran successfully and that the agent shipped logs to CloudWatch.
Evidence:

Verifying CloudWatch Metrics
In the CWAgent namespace, I check the three main metrics of the Case 2 instance:
mem_used_percent
disk_used_percent
procstat_lookup_pid_count
Evidence:
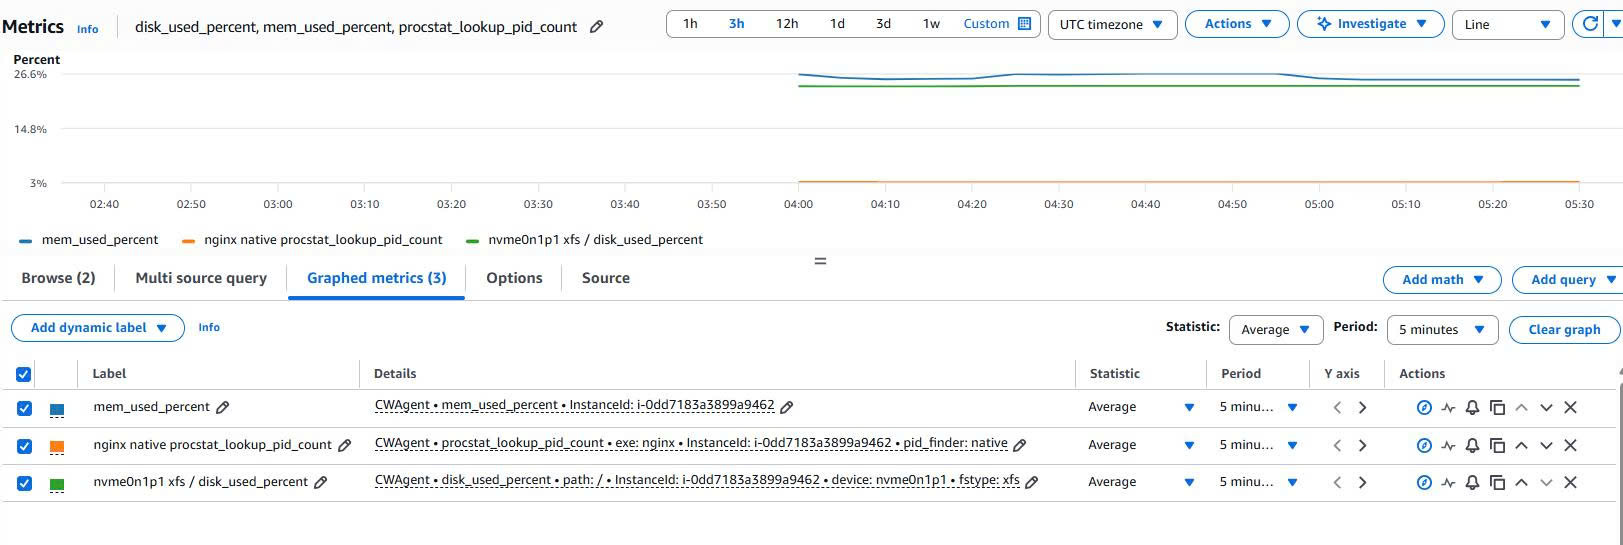
This result proves that the new EC2 instance, bootstrapped via User Data, automatically sent metrics to CloudWatch.
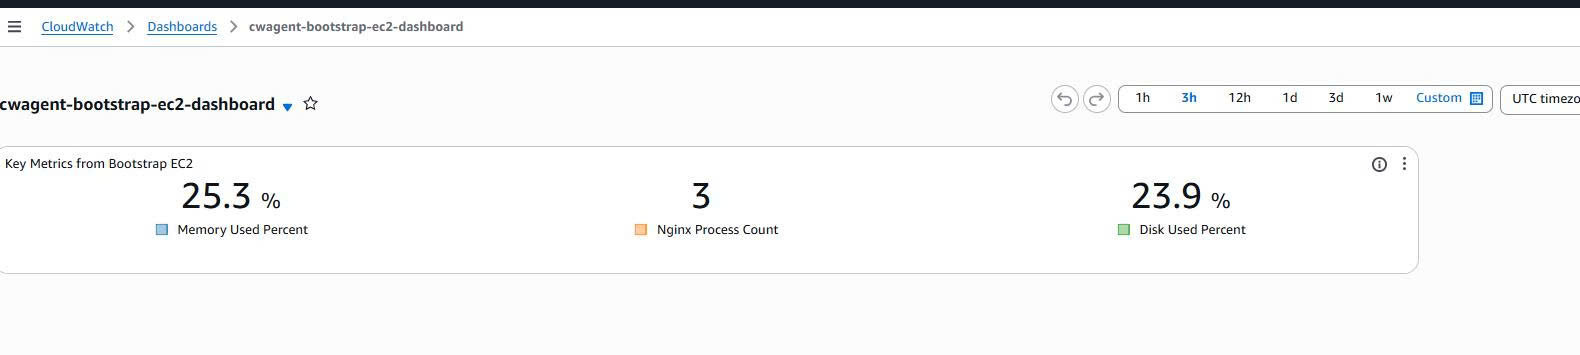
Creating a Dashboard for Case 2
Dashboard name:
cwagent-bootstrap-ec2-dashboard
Widgets displayed:
Memory Used Percent
Nginx Process Count
Disk Used Percent
Evidence:
Case 2 results:
[✓] A brand-new EC2 instance was created from scratch
[✓] The User Data ran successfully
[✓] Nginx was installed and started automatically
[✓] The CloudWatch Agent was installed and started automatically
[✓] Logs were shipped to CloudWatch Logs
[✓] Metrics were shipped to CloudWatch Metrics
[✓] The dashboard visualizes the key metrics
Comparing the two deployment approaches
| Criterion | Case 1: Existing EC2 | Case 2: New EC2 from scratch |
|---|---|---|
| Situation | EC2 already exists | EC2 created fresh |
| How the agent is installed | Installed manually while EC2 is already running | Installed automatically via User Data |
| Goal | Retrofit observability | Bootstrap observability |
| Best when | The server is already running in dev/prod | You want a new server to have monitoring from the start |
| Key evidence | Agent running, metrics, logs, alarm, SNS, dashboard | User Data, agent running, logs, metrics, dashboard |
Case 1 fits when you already have a running system and want to add observability without changing how the instance is launched.
Case 2 fits when you want to standardize how new EC2 instances are created: the moment the instance boots, it already has Nginx, the CloudWatch Agent, logs, metrics, and is dashboard-ready.
Lessons learned
The CloudWatch Agent is a crucial piece if you want to observe EC2 more deeply than basic monitoring.
Without the CloudWatch Agent, you mostly see metrics outside the instance such as CPU, network, disk I/O, and status checks. With the CloudWatch Agent, you additionally get:
Memory usage
Disk usage per filesystem
Application logs
System logs
Process status
Custom metrics in the CWAgent namespace
Another important point is that an IAM Role should be used instead of access keys. When EC2 has the right role, the CloudWatch Agent automatically uses those permissions to send metrics/logs to CloudWatch.
The lab also shows that Session Manager is a better choice than SSH in a lab or a basic production environment, because there is no need to open port 22 to the Internet.
Cleanup
After finishing the lab, clean up to avoid incurring cost. Besides deleting the EC2 instances, dashboards, alarms, and SNS, pay attention to the CloudWatch Log Groups as well, since a log group can keep logs for a long time if no retention policy is set.
Terminate EC2 Case 1 if it was only used for the lab
Terminate EC2 Case 2
Delete the CloudWatch Dashboards
Delete the CloudWatch Alarms
Delete the SNS Topic
Delete the CloudWatch Log Groups if you do not need to keep them
Delete the IAM Role if it was only used for the lab
Conclusion
This lab builds an AWS-native observability pipeline for EC2 with the CloudWatch Agent. Across the two cases, I validated both deployment directions:
Existing EC2
→ install the CloudWatch Agent manually
→ add observability to a running workload

New EC2
→ bootstrap via User Data
→ have observability from the moment of launch
By combining the CloudWatch Agent with CloudWatch Metrics, CloudWatch Logs, a Dashboard, an Alarm, and SNS, you can build a monitoring system that is simple, easy to understand, realistic enough for a basic DevOps environment, and can be extended further for larger workloads.