Blog
Thoughts on engineering, design, and building great products.
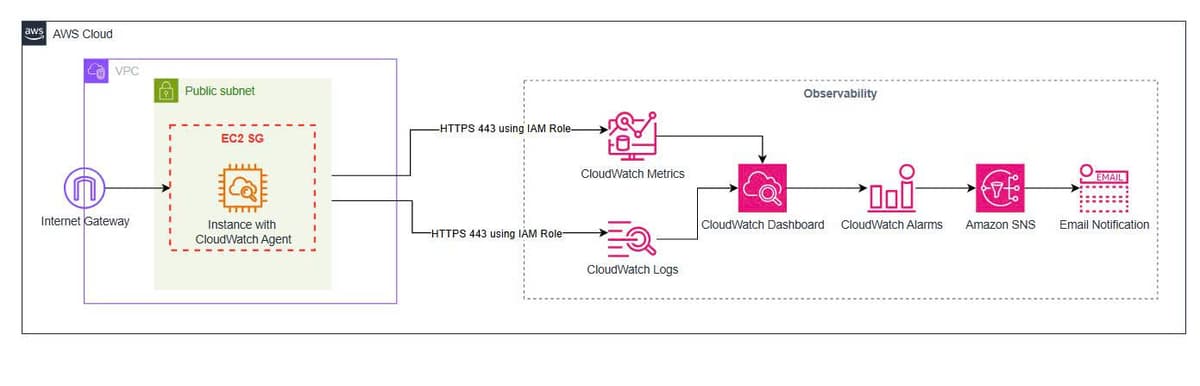
AWS-native Observability for EC2 with the CloudWatch Agent
A hands-on lab building an observability pipeline for EC2 with the CloudWatch Agent, CloudWatch Logs, CloudWatch Metrics, Alarms, SNS email and a Dashboard, across two real cases: installing the agent on an existing EC2 instance, and bootstrapping the agent at launch time on a brand-new one.
CloudWatch: Alarms, Dashboards, and SLOs for the API
With logs, traces, and metrics in place, the next step is knowing automatically when the system has a problem. Define SLOs for the API, build CloudWatch alarms that fire when errors or throttles cross a threshold, gather metrics into a dashboard, and use Logs Insights to compute indicators from structured logs. Push a real alarm into ALARM state by causing a throttle.
Observability: Lambda Powertools and X-Ray Tracing
Start operating like production by being able to see inside. Wire in Lambda Powertools for structured JSON logs and pushed metrics, enable X-Ray to trace which services a request passes through. Read a real trace showing the resolver calling DynamoDB and EventBridge as subsegments, and a log line carrying a trace id to link logs to traces.
Inside Hubble: From eBPF Events to Cluster-Wide Network Flows
Hubble lets us see every connection in a Kubernetes cluster by pod name, service, and policy verdict — without a sidecar in any pod. This article dissects the mechanism: Cilium's eBPF datapath (the 74 sched_cls programs from Article 12) calls bpf_perf_event_output to push events into a perf ring buffer named cilium_events; cilium-agent reads them out with numeric identities; then Hubble enriches them — turning identity 18203 into kube-system/coredns — via the identity-to-label store.
Capstone: Writing connmon — A Node-Wide TCP Connection Monitor
The final article: assembling everything learned into a real tool. connmon attaches a kprobe to tcp_connect in the kernel, pushes every new TCP connection through a ring buffer, and a Go loader prints them in real time — pid, process, destination IP:port. Just over a hundred lines, a single static binary, run it on the cluster and immediately see coredns, kubelet, curl connecting out. Includes a real kprobe build trap. Then a look back over the whole eBPF journey from scratch.
bpftrace: Tracing in a Single Line
Part I wrote eBPF programs by hand in C, with clang and bpftool — many steps for a simple question like 'which process is opening which file'. bpftrace is the shortcut: one command line answers immediately, no C, no clang. But underneath it's still eBPF — this post proves it (bpftool sees the bpftrace program load then disappear), then walks through the probe/filter/action syntax, the 122 thousand probes you can attach to, and the built-in variables, via one-liners that run for real.
Node Log Query and Fine-grained Kubelet Authorization
Article 65 viewed system logs by SSHing into each node to run journalctl. v1.36 lets you query those logs straight through the kubelet API, no SSH. And it comes with a security change: kubelet API access, previously lumped under nodes/proxy, is now split per endpoint — letting you grant exactly nodes/metrics to a monitoring agent without handing over logs or exec. The final article of Part XIV, both touching components we built in Part I.