CloudWatch: Monitoring and Viewing Your Application's Logs
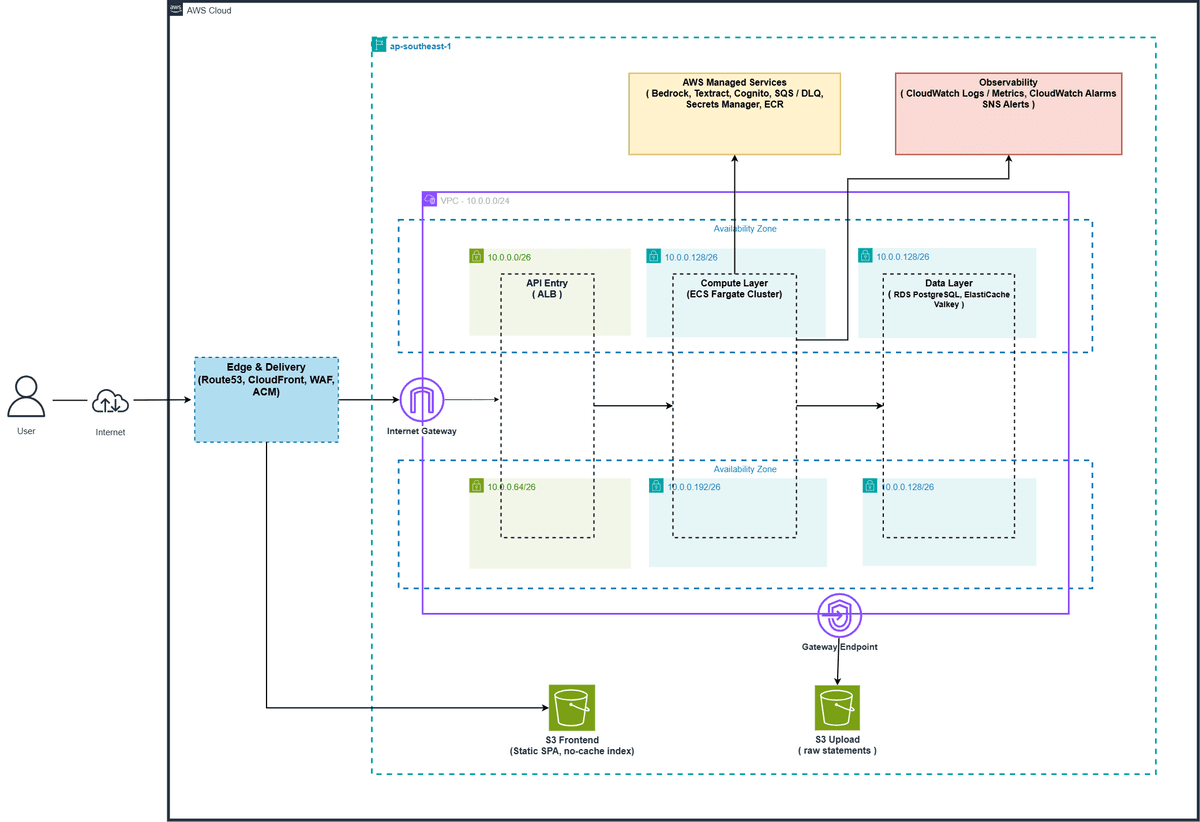
In this article we add monitoring to the system: create an alarm that emails you when the EC2's CPU spikes, and ship the application's logs to a central place to view. After the Article 7 pipeline deploys automatically, this is the part that lets you know how the system is doing.
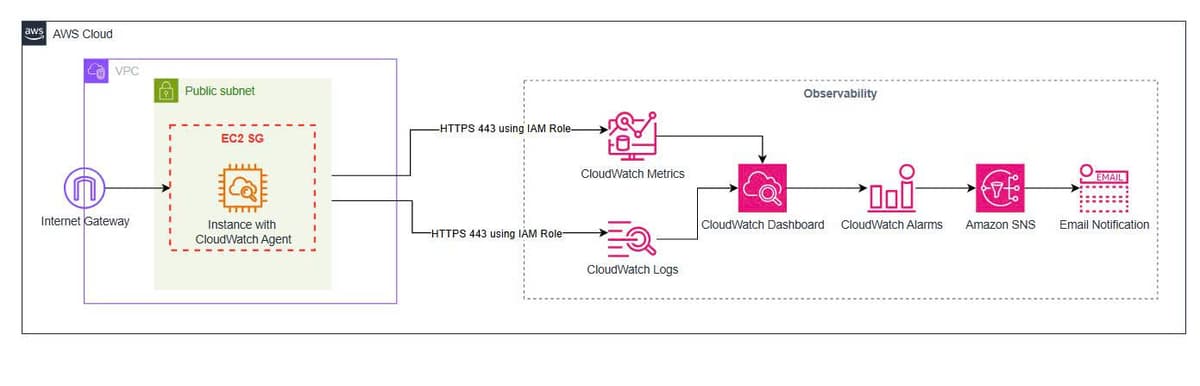
CloudWatch is AWS's monitoring service. It collects metrics (numbers like CPU, network, memory), stores logs, and lets you set alarms when a metric crosses a threshold. SNS (Simple Notification Service) is the notification service; we use it to have the alarm email you.
Goals
- Create an SNS topic and subscribe an email to receive notifications.
- Create a CloudWatch alarm tracking the EC2's CPU, alerting via SNS.
- Ship container logs to CloudWatch Logs and view them.
- Clean up.
Expected cost
- CloudWatch alarm: the legacy model gives 10 alarms free per month; the credit model deducts from credit (a very small cost).
- SNS email: nearly free at learning scale (the free email quota is very generous).
- CloudWatch Logs: charged by the volume of logs pushed and stored; the few log lines in this article are negligible.
- EC2: as in Article 2.
The cost driver is still EC2; alarms and logs left around long-term also incur a little, so we clean up at the end.
Prep
You need a running EC2 with the todo-app container as at the end of Article 7. If you cleaned up, stand up EC2 again and run the container again (pull from ECR as in Article 7, or build directly). Set a few variables on your machine:
REGION=ap-southeast-1
INSTANCE_ID=$(aws ec2 describe-instances \
  --filters Name=instance-state-name,Values=running \
  --query "Reservations[0].Instances[0].InstanceId" --output text)
echo $INSTANCE_ID
Step 1: Create an SNS topic and subscribe an email
The alarm needs somewhere to send notifications. We create an SNS topic and subscribe an email to it.
# Create the topic
TOPIC_ARN=$(aws sns create-topic --name devops-alerts \
  --query "TopicArn" --output text)
echo $TOPIC_ARN

# Subscribe an email to the topic (use your own email)
aws sns subscribe \
  --topic-arn $TOPIC_ARN \
  --protocol email \
  --notification-endpoint ban@example.com
AWS sends a confirmation email to that address. Open the email and click "Confirm subscription" — if you don't confirm, you won't receive alerts. Check the subscription status:
aws sns list-subscriptions-by-topic --topic-arn $TOPIC_ARN \
  --query "Subscriptions[].{Endpoint:Endpoint,Status:SubscriptionArn}" --output table
When the status column shows an ARN (instead of PendingConfirmation), it's confirmed.
Step 2: Create an alarm tracking CPU
EC2 sends the CPUUtilization metric to CloudWatch by default, no extra setup needed. We create an alarm: if average CPU exceeds 70% over two consecutive 5-minute periods, fire an alarm and send to SNS.
aws cloudwatch put-metric-alarm \
  --alarm-name todo-ec2-high-cpu \
  --alarm-description "Canh bao khi CPU EC2 vuot 70%" \
  --namespace AWS/EC2 \
  --metric-name CPUUtilization \
  --statistic Average \
  --period 300 \
  --evaluation-periods 2 \
  --threshold 70 \
  --comparison-operator GreaterThanThreshold \
  --dimensions Name=InstanceId,Value=$INSTANCE_ID \
  --alarm-actions $TOPIC_ARN
A few parameters explained:
--period 300and--evaluation-periods 2: evaluate the average every 5 minutes, requiring 2 consecutive periods over the threshold before alarming. Requiring consecutive periods avoids false alarms when CPU only spikes briefly.--alarm-actions $TOPIC_ARN: when entering the ALARM state, send to the SNS topic.
View the alarm state:
aws cloudwatch describe-alarms --alarm-names todo-ec2-high-cpu \
  --query "MetricAlarms[].{Name:AlarmName,State:StateValue}" --output table
Initially the alarm is usually in INSUFFICIENT_DATA (not enough data), then moves to OK. To test triggering it, SSH into the EC2 and generate fake CPU load for a few minutes:
# On EC2: pin the CPU busy for about 5 minutes (the 2 instances = 2 cores)
timeout 360 sh -c 'while true; do :; done & while true; do :; done'
After a few minutes, the alarm moves to ALARM and you receive an email from SNS. When the load drops, it returns to OK.
Step 3: Ship container logs to CloudWatch Logs
Right now the app's logs only live in the container on EC2; you have to SSH in to view them, and they're lost when the container is deleted. We push the logs to CloudWatch Logs to view them centrally and keep them.
Docker supports sending logs straight to CloudWatch via the awslogs log driver. To use it, EC2 needs permission to write logs. If you did Article 7, the EC2 already has the ec2-ecr-pull role attached; add CloudWatch Logs write permission to that role:
aws iam attach-role-policy \
  --role-name ec2-ecr-pull \
  --policy-arn arn:aws:iam::aws:policy/CloudWatchAgentServerPolicy
Create a log group to hold the logs:
aws logs create-log-group --log-group-name /todo-app
SSH into EC2 and run the container again with the awslogs log driver (stop the old container first):
docker stop todo-app && docker rm todo-app

docker run -d --name todo-app -p 80:3000 --restart unless-stopped \
  --log-driver=awslogs \
  --log-opt awslogs-region=ap-southeast-1 \
  --log-opt awslogs-group=/todo-app \
  --log-opt awslogs-stream=container \
  <IMAGE>
Replace <IMAGE> with the image you're using (for example the ECR image from Article 7). Hit http://<EC2_IP> a few times to make the app produce logs.
View the logs from your machine:
aws logs tail /todo-app --follow
logs tail --follow follows new logs like tail -f. You'll see the line Server dang chay tren cong 3000 and requests hitting the app. The logs now live on CloudWatch, not lost when the container is replaced on the next deploy.
Set a log retention period so old logs are deleted automatically, avoiding accumulation that costs money. For example, keep 7 days:
bash
aws logs put-retention-policy --log-group-name /todo-app --retention-in-days 7
🧹 Cleanup
Delete what you just created. EC2 is still the main cost driver.
# Delete the alarm
aws cloudwatch delete-alarms --alarm-names todo-ec2-high-cpu

# Delete the log group (along with all logs inside)
aws logs delete-log-group --log-group-name /todo-app

# Delete the SNS topic (along with its subscriptions)
aws sns delete-topic --topic-arn $TOPIC_ARN
If in Step 3 you added a policy to the EC2 role and no longer intend to use it, detach it:
aws iam detach-role-policy --role-name ec2-ecr-pull \
  --policy-arn arn:aws:iam::aws:policy/CloudWatchAgentServerPolicy
Finally, if you're not continuing right away, terminate EC2 and delete the ECR repository as in the Article 7 cleanup.
Wrap-up
You just added two important monitoring pieces: an alarm that proactively emails you when CPU is abnormal, and centralized logs on CloudWatch to see what the application is doing. Together with the Article 7 pipeline, you can now deploy automatically and know when something goes wrong — enough of the basic pieces of an operable system.
Article 9 is the last one: we audit the entire account to make sure no resource is quietly racking up charges, review the best practices, and suggest where to go next.